Getting the Picture

It’s like this: Averages are your enemy because they hide change. Making graphs is easy and cheap and sometimes they uncover secrets; more of us should do it more.
What happened was, I was working on some software that takes an incoming flow of messages and stuffs them into an Amazon Kinesis stream. Kinesis is a thing that can soak up a whole lot of data really fast; the way it works is that you configure it with a number of “shards”, and each shard can soak up a thousand messages per second, or a megabyte per second, whichever comes first. There’s nice software for reading the messages out and doing useful stuff with them. It turns out there are lots of apps where Kinesis or something like it — I hear that Apache Kafka is good too.
Kinesis will deal out the messages among the shards automatically if you want, but I didn’t, I wanted to deal them out in a particular way to achieve a particular effect. And I was having a lot of trouble making it work, lots of messages were falling on the floor, making me sad.
Which was really odd, because I’d configured this particular stream with 24 shards, the messages were averaging around 1K bytes each, and they were arriving at only about 7 thousand per second (we say “7K TPS”). This is a development setup, the TPS when we go live will have lots more digits in front of the K. I remember when I used to think that a thousand transactions a second was a lot.
When you try to stuff too much data into Kinesis, it “throttles” you, saying “sorry, this shard is busy, wait a while or try somewhere else.” Now, my software was supposed to be smart enough to detect this and sensibly pick another shard, routing around the problem. But still, I kept hearing the discouraging pitter-pat of messages hitting the floor.
So I spent quality time munging through logfiles with grep and sed and ruby scripts, and eventually it became obvious that at certain times, all of the shards were throttling me at the same time.
Which made no sense at all, because I had more or less three times the number of shards I needed for the 7K TPS. (At this point, some of the wiser readers are already shaking their heads and laughing at me.)
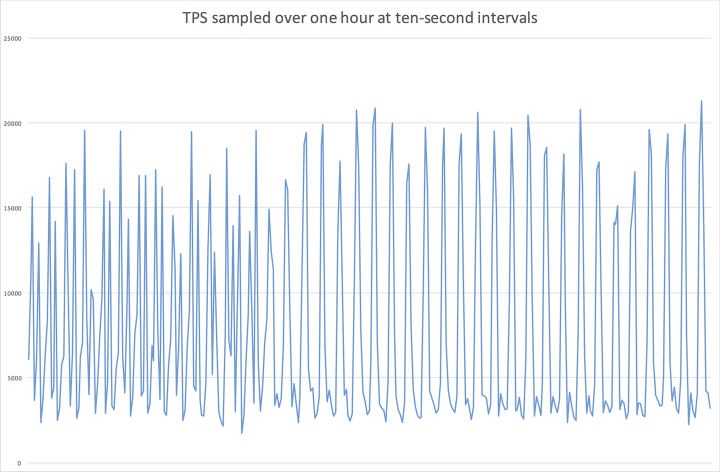
“Gosh,” I thought, “maybe the load is uneven.” So I ran a little script over the logfile and computed the TPS every minute. Still pretty flat, between 5K and 7K TPS. I turned the reporting interval down to ten seconds and OMG, the numbers were all over the place. At this point I decided to do what I should have done off the top and graph the TPS.
Well, there you go. The upstream system was highly periodic and while the average TPS was sane, it regularly ran right up against the capacity of the stream; at this point, my software’s pathetic attempt to shuffle the messages from shard to shard only made things worse.
How, you ask, do you graph numbers like this? Methods vary, but mine is to dump them into a text file whose name ends in “.csv” then have my local operating system open it with whatever the default spreadsheet app is, select the first column, and say “graph this”.
Credit · I first, or anyhow most recently, learned this lesson from Martin Thompson, at the Goto; conference in Denmark in 2014. He’s a heavy optimization geek and gave a speech about how he had a weird throughput problem and no matter how he averaged the numbers they hid the problem. Until he graphed them and saw it. Yup.
Comment feed for ongoing:
From: Byron (Apr 09 2016, at 12:46)
In Kafka (we're on AWS but had Kafka long before we had Kinesis access, but the two systems appear similar) what I tend to do is use two topics. The first randomly distributes to try to smooth the load and provide safety in the sense of not dropping messages. I then use a simple consumer to redistribute the messages by shard key. Basically, the edge is as dumb and fast as possible.
[link]