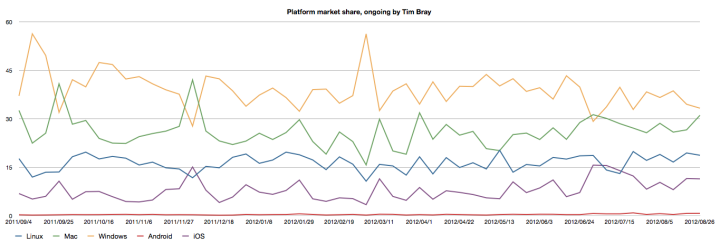
Last night on impulse I spent a couple hours scripting and graphing and here’s a snapshot of the browser and operating-system market-share numbers as seen by this blog. The big trend is that there are no big trends.
(For a while back in 2005-2007, I published a regularly-updated graph of the browser-market-share numbers. But it was too much work, and seemed less and less newsworthy. I have no plans to repeat this exercise regularly.)
Platforms · Less Mac and more Linux than I would have expected; but what’s really interesting is that, in the last 12 months, not that much has changed.
Browsers · Once again, a remarkably static picture. Well, I suppose Chrome is growing noticeably; but still, the big story is the lack of obvious trends.
Methodology · The numbers are percentages.
The snapshot covers just under a year. This isn’t all the traffic, it’s very specifically the traffic due to humans opening a page here in a browser; that is to say, they’ve followed a link (possibly from a search engine) or a bookmark. The vast majority of actual eyeballs looking this content are using some feed reader or another, and a substantial majority of those are on Macs.
I used Josh Peek’s useragent gem, plus some code I wrote to sort things into bigger baskets. I’ve forked it on github and should really push my add-ons back, but the implementation is surprising [UserAgent#parse returns an Array with methods jammed in via Object#extend (?)]; will have to do some extra thinking to figure out how to add stuff cleanly.
Comment feed for ongoing:
From: John Cowan (Aug 28 2012, at 10:25)
I think the interesting things to say are about the browser graph: Chrome is beginning to cannibalize Firefox, and IE is now the browser for the Rest Of Them -- your audience is basically elite-technical, and only a small proportion of them use IE.
Of course, too much shouldn't be read into this or any other single set of numbers, blah blah blah.
[link]
From: Blz (Aug 30 2012, at 23:32)
Hello,
Its quite interesting to see these statistics. I really like the graphs - they are very visuall. Could you reveal how did you generate them? It is some sort of js or ruby graph library?
Regards,
Blz
[link]