Some Sundays I make graphs of statistics from the ongoing web-server log files. I find them interesting and maybe others will too, so this entry is now the charts’ permanent home. I’ll update from time to time.
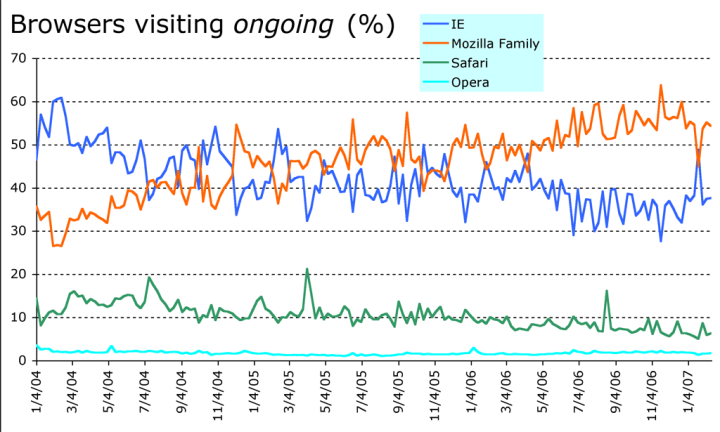
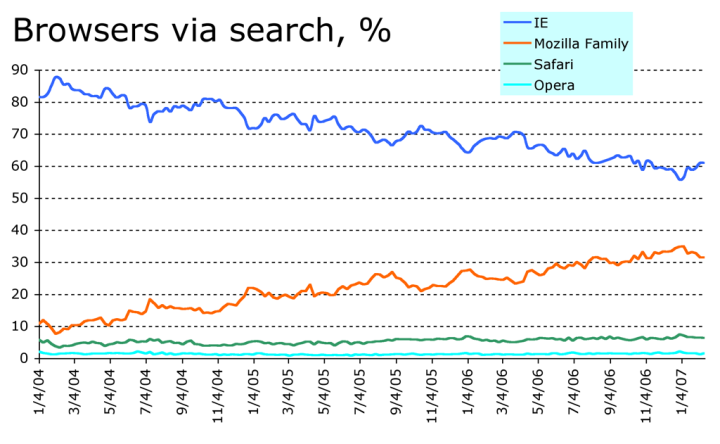
[Updated: 2007/02/11] Wow, I hadn’t got around to an update since last October. There’s been lots of interesting action. I suspect the browser-share disturbance has to do with the launch of IE7. It may also be the case that the increasing popularity of some really non-technical search strings is pushing that traffic flow back towards the IE old guard. Paul Hoffman has been bugging me to graph the uptake of IE7 and I suppose I should.
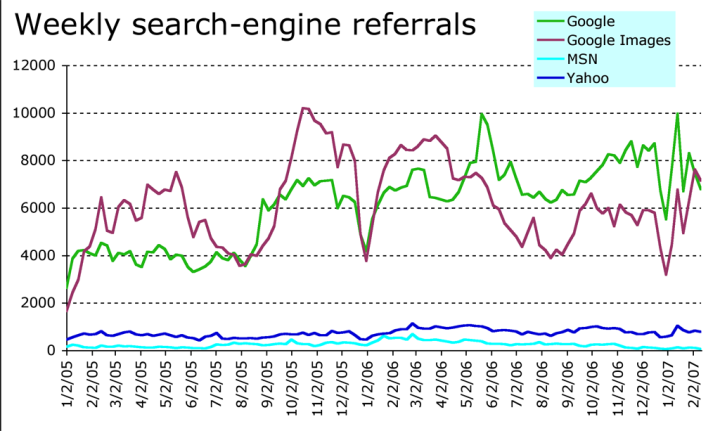
I have no explanation for the gyrations in the search-engine graph; if they continue I’ll have to do some research.
Browsers visiting ongoing, percent.
Browsers visiting ongoing via search engines, percent.
Search referrals to ongoing .
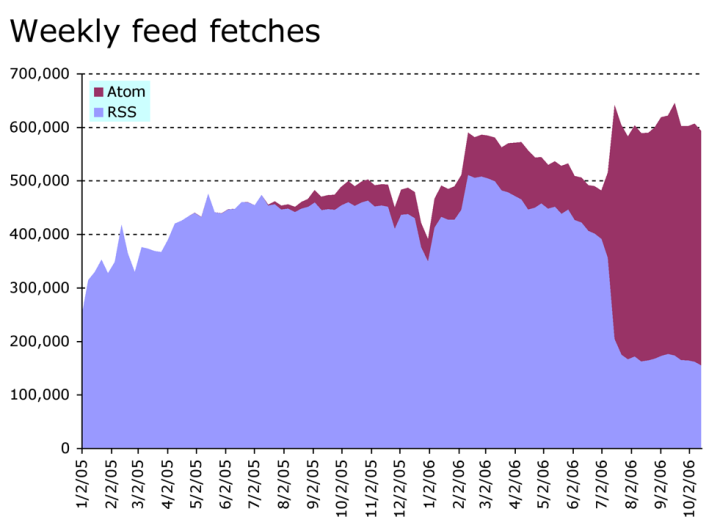
The following graph is no longer interesting, showing a fairly steady number of feed fetches to my Atom feed and a residual flow of moronic poorly-programmed clients ignoring the permanent redirect and trying to fetch my old RSS feed. I don’t like discarding information, so I’m going to leave it frozen in its Autumn-2006 state.
Fetches of the RSS 2.0 and Atom 1.0 feeds.
What a “Hit” Means ·
I recently
updated the
ongoing software
to do some AJAX-y stuff.
The XMLHttpRequest now issued by each page seems to be a
pretty reliable counter of the number of actual browsers with humans behind
them reading the pages. I checked against
Google Analytics
and the numbers agreed to within a dozen or two on days with 5,000 to 10,000
page views; interestingly, Google Analytics was always 10 or 20 views
higher. 
Anyhow, do not conclude that now I know how many people are reading whatever it is I write here; because I publish lots of short pieces that are all there in my RSS feed, and anyone reading my Atom feed gets the full content of everything. I and I have no #&*!$ idea how many people look at my feeds.
As a result of doing this, I turned off Google Analytics; they weren’t adding much that was of interest, are a little too intrusive and I think were slowing page loads.
Anyhow, I ran some detailed statistics on the traffic for Wednesday, February 8th, 2006.
| Total connections to the server | 180,428 |
| Total successful GET transactions | 155,507 |
| Total fetches of the RSS and Atom feeds | 88,450 |
| Total GET transactions that actually fetched data (i.e. status code 200 as opposed to 304) | 87,271 |
| Total GETs of actual ongoing pages (i.e. not CSS, js, or images) | 18,444 |
| Actual human page-views | 6,348 |
So, there you have it. Doing a bit of rounding, if you take the 180K transactions and subtract the 90K feed fetches and the 6000 actual human page views, you’re left with 84,000 or so “Web overhead” transactions, mostly stylesheets and graphics and so on. For every human who viewed a page, it was fetched almost twice again by various kinds of robots and non-browser automated agents.
It’s amazing that the whole thing works at all.
Source · A tarball of the scripts that generate this is here. It ain’t pretty. 


Comment feed for ongoing:
From: Claus Dahl (Oct 16 2006, at 06:11)
Like everyone else, I thought feed usage statistics was a lost game, but I recently started adding tracking to my feed as well. It works much better than one would expect.
I added a simple image to each feed entry. It is not protected by javascript or anything.
It turns out that the robots are *not* processing feeds as HTML at this point in time. URLs aren't harvested for download from feeds, and consequently feed HTML seems to be rendered as HTML only by human readers, based on my experience.
The consequence is that the download statistics for the image inclusion actually generates a plausible statistic on how many people read my feed.
I'd be interested to hear from others if they can confirm this observation.
[link]
From: Eliot Kimber (Oct 16 2006, at 11:17)
What does it mean that the IE and Mozilla (presumably mostly Firefox) curves are in almost perfect inverse in the first graph?
The only thing I can think it reflects is ongoing readers moving back and forth between browsers--that is, the number of total readers is more or less constant but they switch browers.
Just curious
[link]
From: Claus (Oct 17 2006, at 00:10)
Eliot, percentages are a zero sum game!
[link]
From: a.zemskov@hotmail.com (Oct 29 2006, at 22:19)
There is an opportunity to distribute{allocate} people and robots by means of unique addresses for rss feeds. For example.
To generate addresses not "/ongoing/ongoing.atom", and a kind "/ongoing/34579836255672/ongoing.atom" where 34579836255672 represents unique id the visitor of a site. And this address for feeds can be generated by means of JavaScript that search systems could not find out such addresses for feeds. Further, if the inquiry was with id in url it means the Human!
As a variant, it is possible to make feed for search engines which address is not visible to visitors, and to make feed for visitors, access to which will be closed for search engines by means of robots.txt
[link]
From: Devon (Feb 11 2007, at 19:20)
I'm starting to not quite like Google Analytics anymore, as it doesn't detect browsers like Elinks, Lynx, or even Firefox with the javascript off. I don't really like that. It means my Google Analytics stats are only showing me information for those people who are using javascript browsers. Sure, that's most everyone...I'm convinced, but I don't have any count from it that shows who else.
[link]