[This fragment is available in an audio version.]
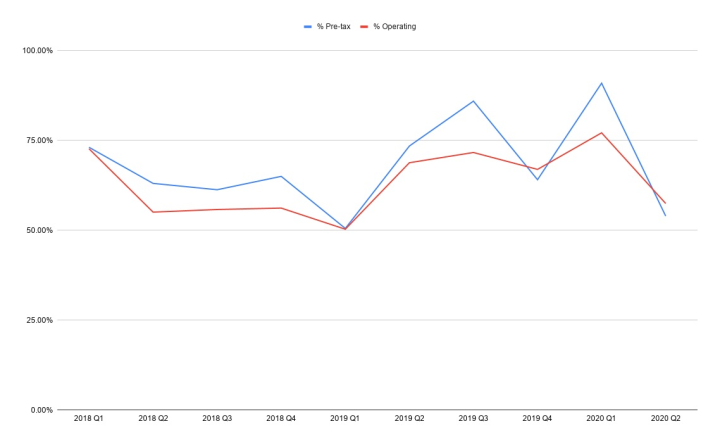
I’ve often heard it said that AWS is a major contributor to Amazon’s profitability. How major? Here’s a graph covering the last ten quarters, with a brief methodology discussion:
I think this is a useful number to observe as time goes by, and it would be good if we generally agree on how to compute it. So here’s how I did it.
Start at the
Quarterly Results page at ir.amazon.com. It
only has data back through 2018 which seems like enough history for this purpose.
Let’s take a walk through, for example, the
Q1 2020
numbers.
Please note: I have zero inside knowledge about the facts behind these numbers. Every word here is based on publicly available data.
It’s easy to identify the AWS number; search in the quarterly for “Segment Information” and there it is: Net sales $10,219M, Operating expenses $7,144M, Operating Income $3,075M. So if we want to know the proportion of Amazon profits that are due to AWS, that’d be the numerator.
So what’s the denominator? Since the AWS results exclude tax, so should the Amazon number. Search for “Consolidated Statements of Operations” and there are two candidates: “Operating Income” and “Income before income taxes”. The first has the same name as the AWS line, so it’s a plausible candidate. But it excludes net interest charges and $239M of unspecified “Other income”.
This is a little weird, since interest is a regular cost of doing business. It might be the case that the interest expense is mostly due to financing computers and data centers for AWS, or alternatively that it’s mostly financing new fulfillment centers and trucks and planes and bulk buys of toilet paper. And then there’s the “Other income”.
If we assume that the “Other income” and net interest gain/loss is distributed evenly across AWS and the rest of Amazon, then you should use the “Operating” line. I’m not 100% comfy with that assertion, so I made a graph with both lines, and I think it’s likely the best estimate of AWS’s proportion of Amazon’s income falls in the space between them.
So, if this graph is right, then over the last couple of years, somewhere between 50% and 80% of Amazon’s profit has been due to AWS. Glancing at the graph, you might think the trend is up, but that verges on extrapolation, I’d want to wait a couple more quarters before having an opinion.
Since I’m not a finance professional, I may have gone off the rails in some stupidly obvious way. So here’s the .xlsx I used to generate the graph. I used Google Sheets, so I hope it doesn’t break your Excel.
Please let me know if you find any problems.

Comment feed for ongoing:
From: Epigone (Jun 15 2020, at 18:00)
This goes "off the rails" in the formulation stage, because the profit share metric is misleading. Two reasons:
1. By strategically excluding unprofitable businesses, you can make many subsets of Amazon appear to be the main profit driver. For example, both NA retail and AWS had 7.3B in operating income in 2018. Excluding the various unrelated moonshots dumped into the NA retail P&L, it is far and away the most profitable Amazon business.
2. The opportunity cost of the investment by Amazon required to build AWS impacts the P&L of other Amazon businesses. Non-AWS businesses would be far more profitable if Amazon hadn't poured so much capital into AWS over the last decade.
[link]
From: David Griffin (Jun 15 2020, at 23:57)
I love analysis like thistle!
The problem is that you can't trust their reported numbers as much as you think. Amazon gets to essentially make up how much the non-AWS parts of the business pay for AWS.
Do teams in retail pay full retail price for EC2, or do they have some kind of rate card with lower prices?
AWS is very capital intensive, so its very hard to track the unit prices through to profits. Your $3 per month EC2 instance is helping to pay off a datacenter, the rack, networking gear, undersea cables, hardware engineers, and tens to hundreds of EC2 teams. Only a small amount of the cost is incremental (e.g. electricity).
So AWS customers are basically paying off CAPEX, but how do we know which Amazon investments is AWS leveraging and vice-versa? It's very hard to untangle all this, even if you had full access to Amazons books.
Another small example: when I was in the Builder Tools org, nobody tracked how much time I spent helping AWS vs CDO teams.
[link]
From: JeffB (Jun 16 2020, at 04:26)
Can we get the data in XML format?
[link]